By now you’ve probably seen our article with details about Monday night’s tornado that touched down near Lake Fenton and traveled seven-and-a-half miles before lifting in extreme northwest Oakland County.
I was watching this storm at home on RadarScope, a radar app commonly used by meteorologists with training in interpreting Doppler radar products. I grabbed some of the radar images so I could explain how we use this technology to help keep you safe (since I was at home, I was not able to grab these images from Storm Tracker 4...but they are essentially the same, just with slightly different coloring).
Recommended Videos
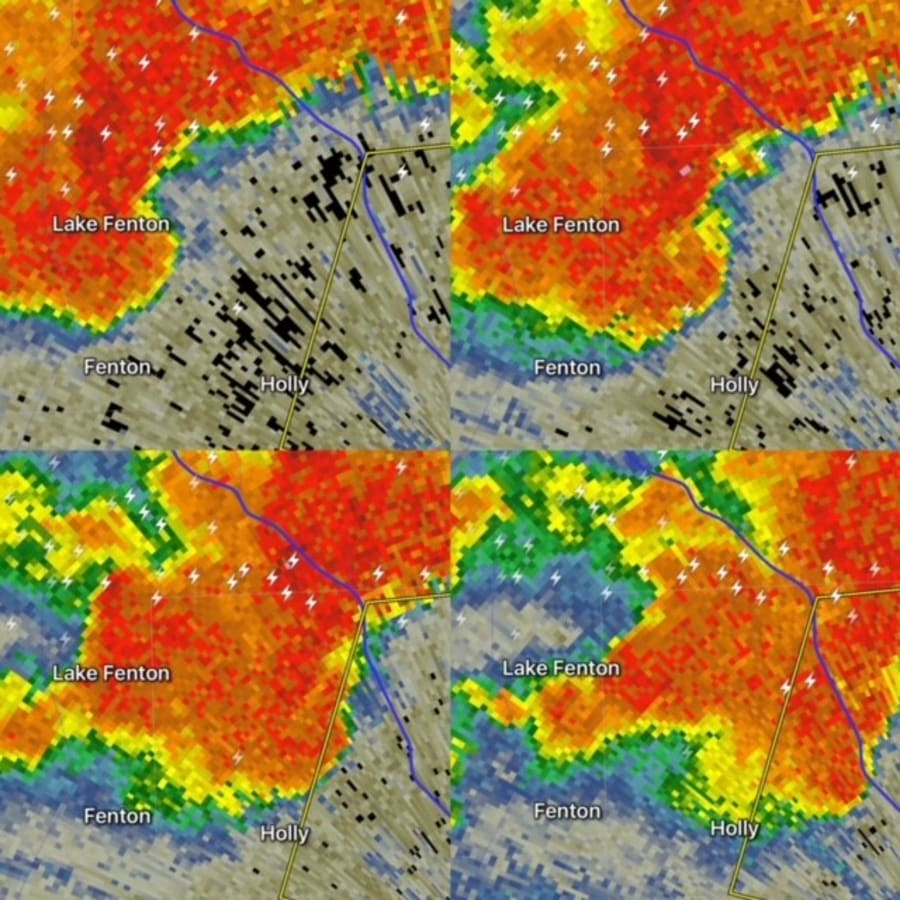
This first set of images below is called reflectivity...this is what we commonly show you on TV. It is basically the radar showing us where rain is, and how intense it is. The images are from 11:34 p.m. to 11:43 p.m., and they are to be viewed in this order:

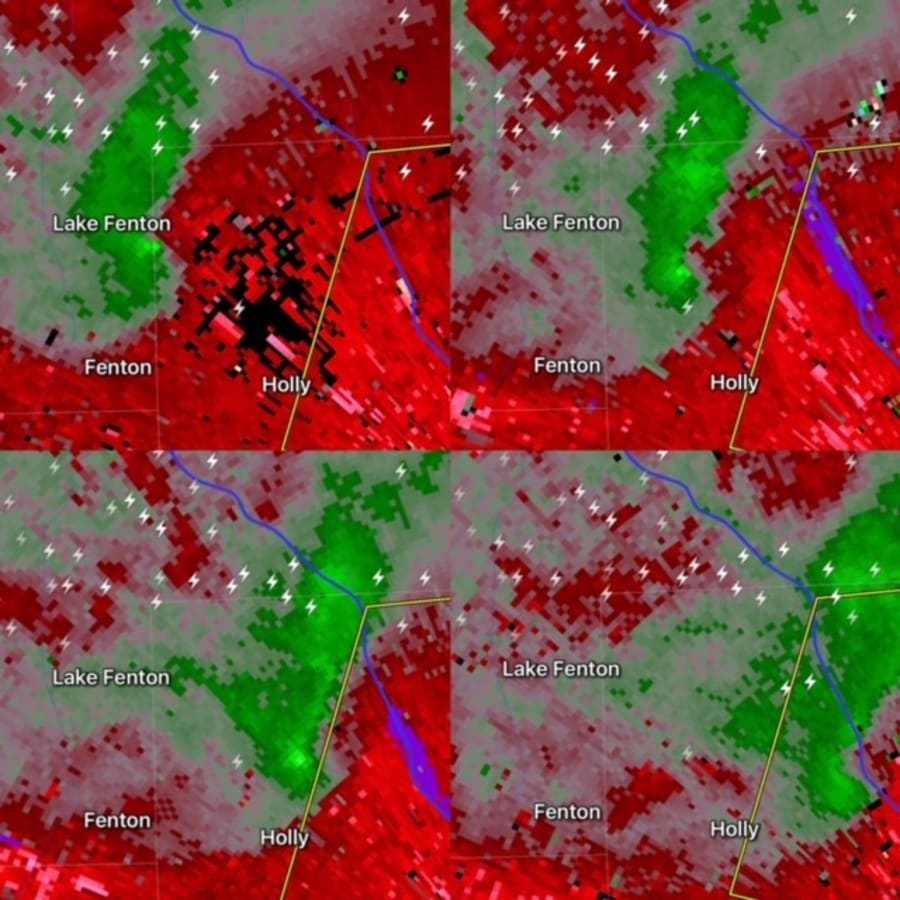
This next series of images (same times as above), is velocity. First, let me explain how the radar sees the wind inside a storm. The beam that the radar sends out leaves the radar at a very specific frequency. When the beam hits the rain, part of it is reflected back to the radar. However, when that beam reflects off raindrops being blown toward the radar it returns at a slightly higher frequency, and returns at a lower frequency when reflected off raindrops blowing away from the radar.
The radar then can compute if the wind is blowing toward or away from the radar and at what estimated speed based upon the change in frequency from when it originally left the radar.
In this image, the National Weather Service’s radar is about twelve miles to the southeast, or just off the lower right part of the image. So, anything colored red is blowing away from the radar, and anything colored green is blowing toward the radar. See that bright patch of green right next to the red near Lake Fenton in the first image? That shows rotation...and you can also see the rapid weakening of the circulation in the last image.
Obviously, the radar beam is not at the ground...the center of the beam is 700-800 feet above the ground at this distance from the radar. So, we are seeing this rotation aloft. But is there any way to determine if it is a circulation in contact with the ground and, hence, a tornado? In this case, the answer is yes.

This next radar product is called correlation coefficient (“CC” for short). The beam emanating from the radar is a dual polarized beam. That means that there are alternating pulses of horizontally and vertically oriented beams pulsing out. This is a critical component of Doppler radar technology because this dual polarization can tell us if the targets it is hitting are uniform or not.
For example, raindrops are a uniform target. So are snowflakes. And in the CC images below, the rouge color, where the radar sees rain, shows relatively uniform targets. However, look just below the “n” and “t” in “Fenton” in the first image.
See that little hole in the pattern? That is a much lower value of CC than the surrounding rouge color and indicates non-uniform targets. In other words, probably leaves, branches, etc. in the air along with the rain. We call this a debris ball, and you can follow it through the first three images, and then it’s gone in the last image. You are actually seeing debris in the air here (which I was seeing in real time last night). That’s radar confirmation of a tornado.
Obviously, not every tornado is this close to a radar, nor is strong enough to lift debris very far into the air. So CC is not the end-all to determine if there’s a tornado. But most importantly, when a strong enough tornado touches down, the debris ball is very prominent, and we can pinpoint on Storm Tracker 4 exactly where it is.

I hope this article helps you understand that Storm Tracker 4 is no gimmick...it uses advanced radar technology that truly makes a difference in helping to keep you safe.


